
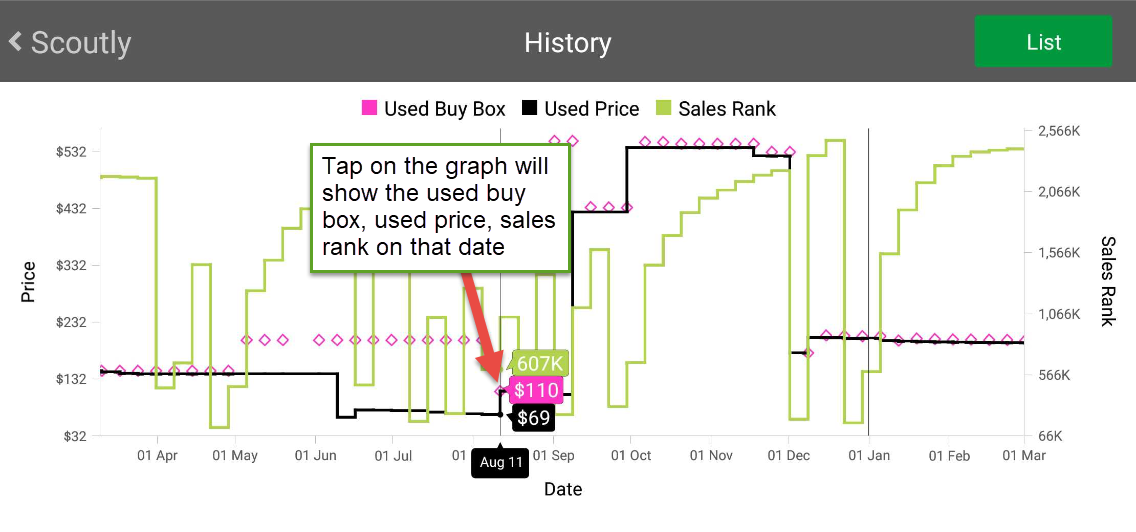
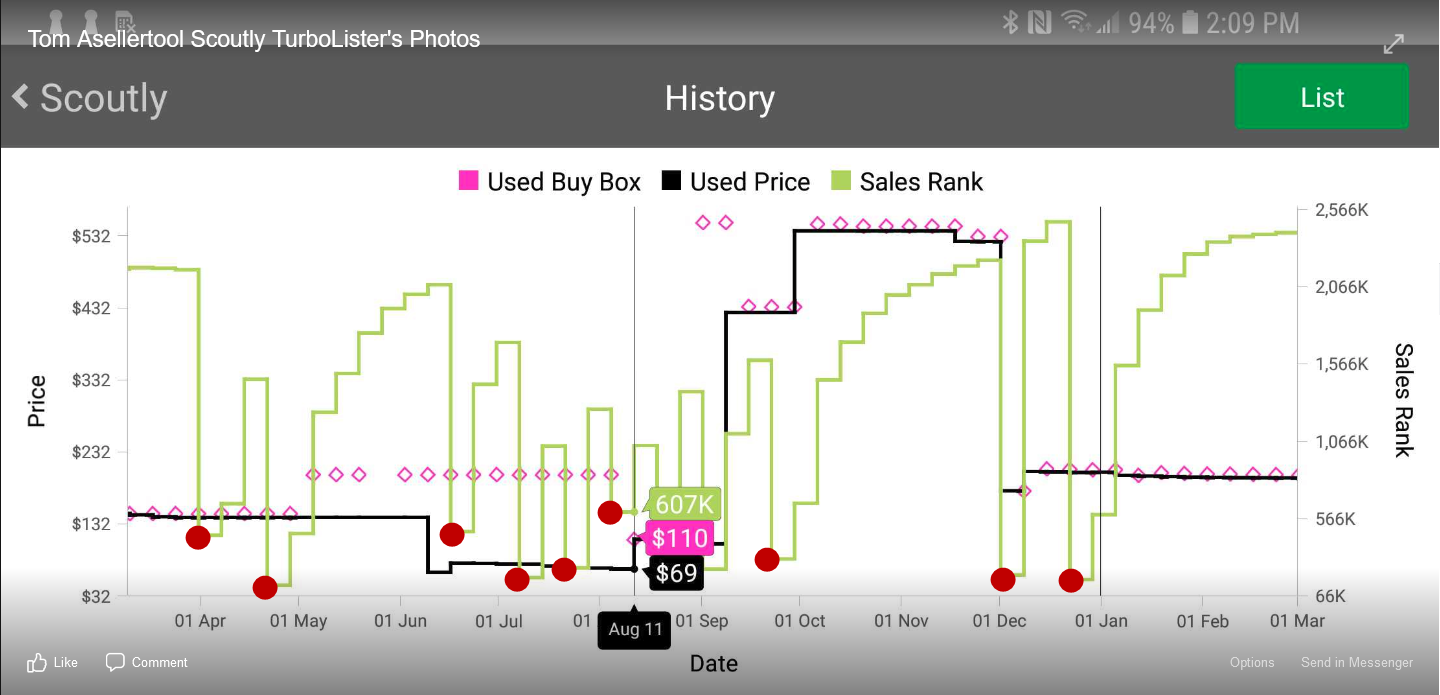
The history of the lowest used offer price, Buy Box price, and sales rank are essential to any successful seller. You can use this info to determine the possible time frame to sell this item at a reasonable price.
Scoutly can display up to *2 years” history data.
Method 1: View the Sales History Chart in Scoutly (Free and without a Keepa subscription)
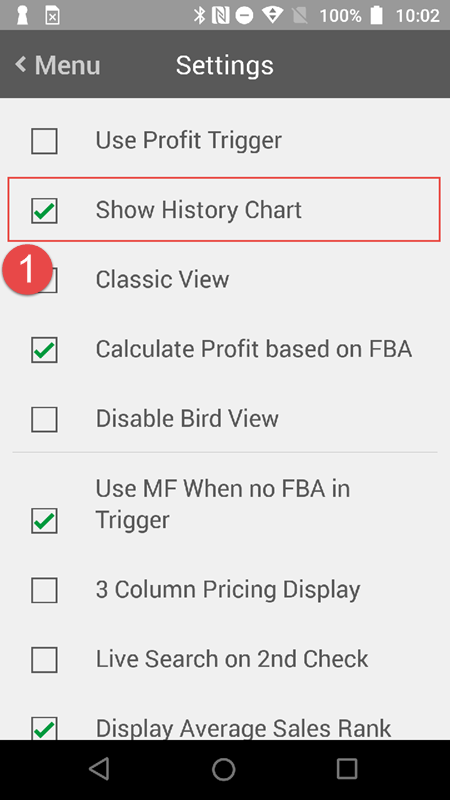
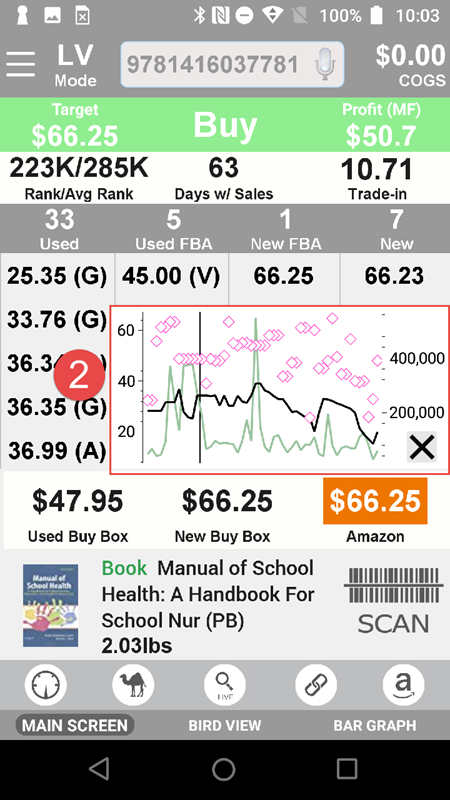
Turn on “Show History Chart” (1) in Settings. Then, after performing a live search, the Scoutly app will show you a thumbnail image (2) of the lowest used price, used Buy Box price, and sales rank history for the past 12 months. You can tap on the thumbnail image to see the history chart on the whole screen. On the entire screen, you can tap on the graph to see the used buy box, used price, sales rank, and up to 2 years of data. If you disable “Show History Chart” (1) in Settings, tap the History icon in the toolbar or select from the HotLink list to display the history.
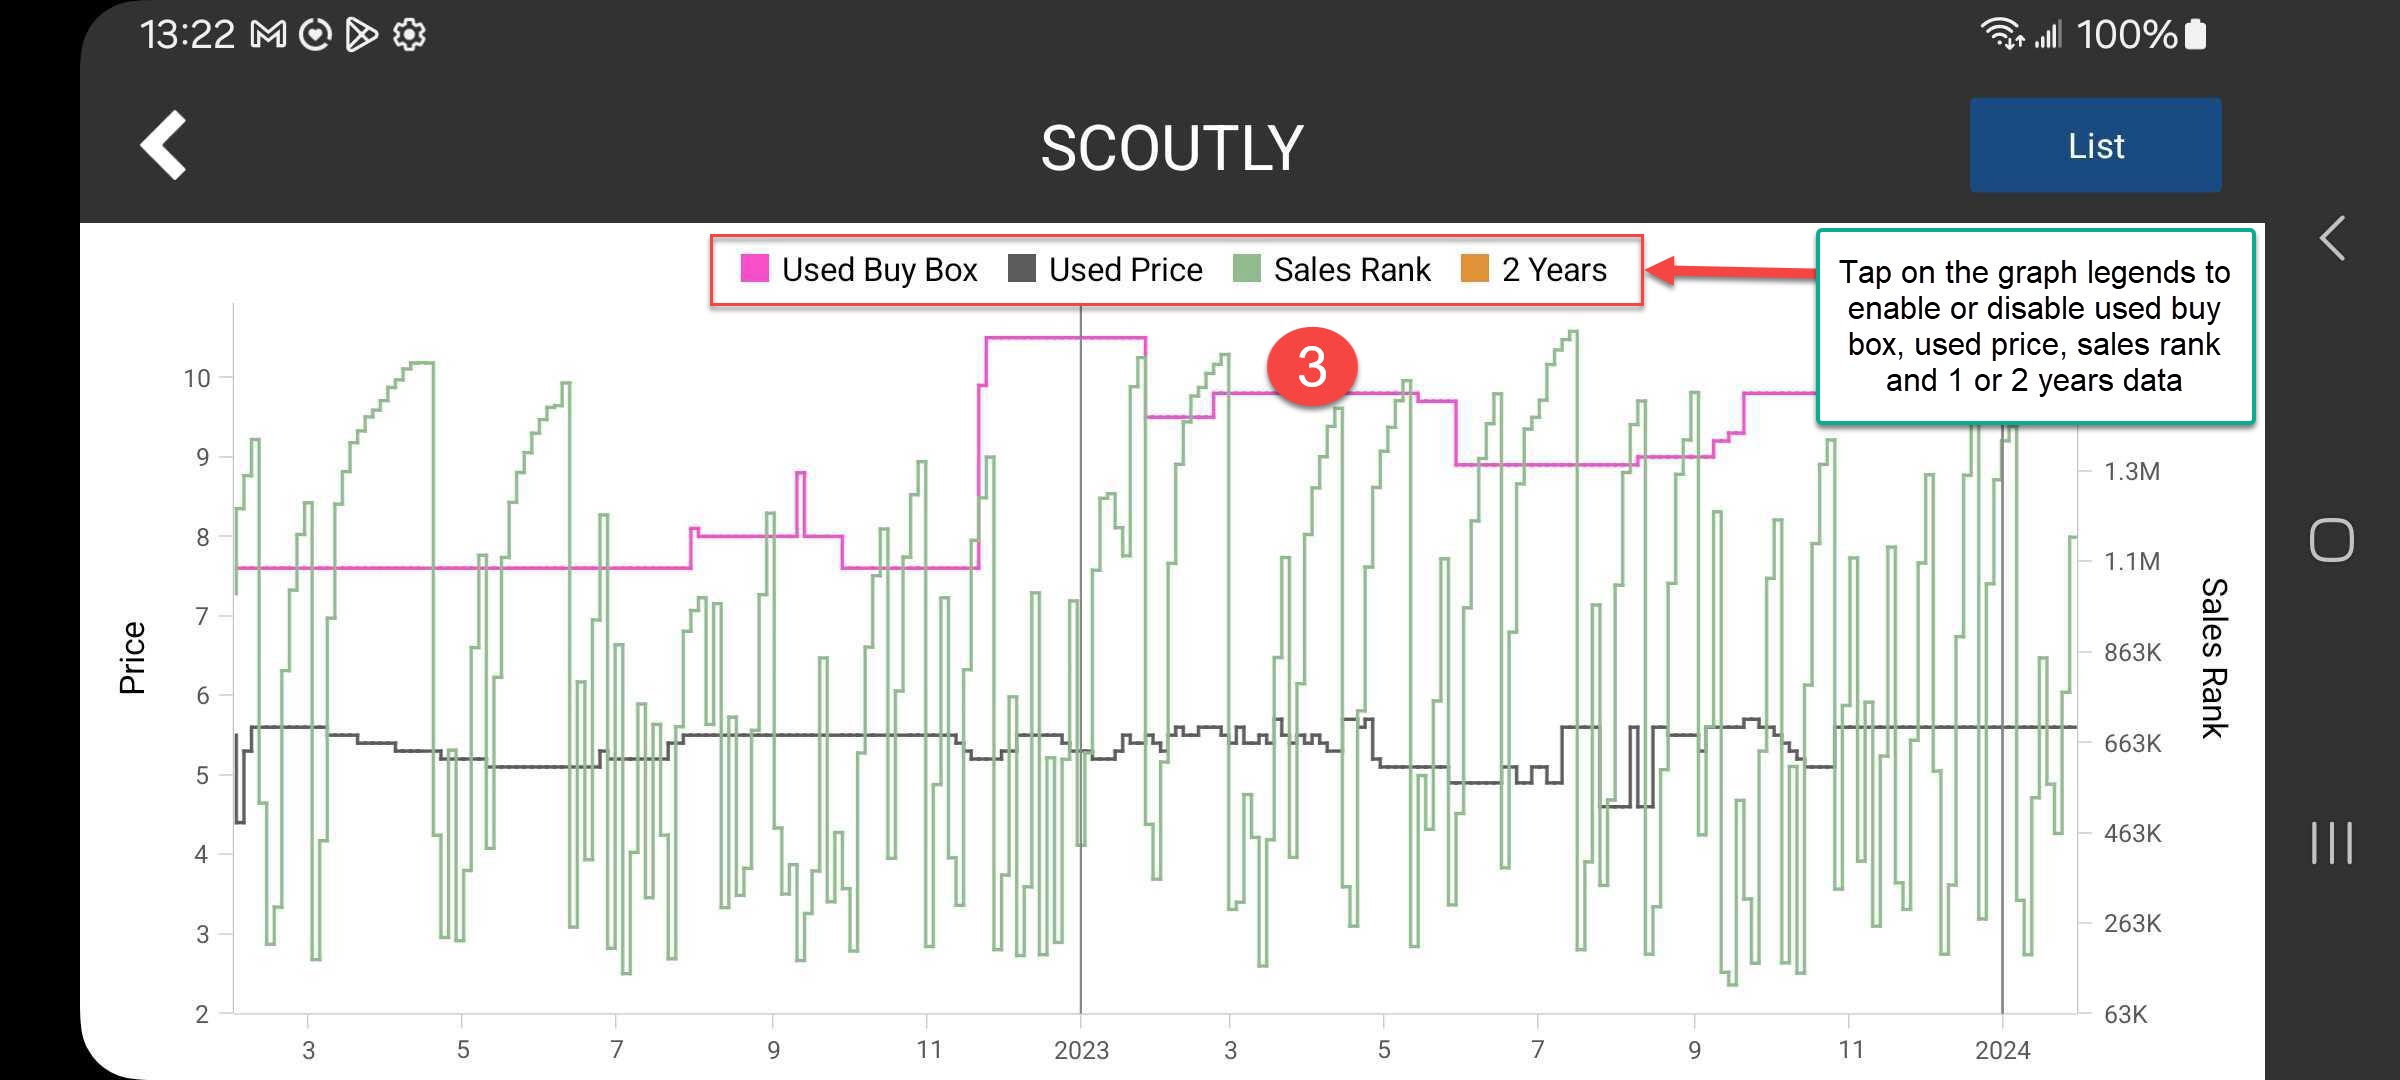
You can tap the graph legend (3) to enable or disable pricing and sales rank history.
When you see a drop in the sales rank line, it indicates at least one sale. We circle them with a red circle in the graph below.
Method 2: With Keepa Subscription
If you subscribe to a Keepa data subscription ($17 a month), you can log in to the Keepa site with your account to see the sales rank data. You must create a custom link to Keepa, which you can do by following the directions here.
Post your comment on this topic.